Stress Testing risk parameters
We are going to stress testing the below trading parameters of our trading strategy.
Risk per trade: -1.4% (after scaling out, risk would be -1%)
Target profit per trade: +2% (minimum target profit per trade)
Success percentage 45% (our history shows that we have achieved over than 58% success %)
Number of performed trades per year: 240 trades (each trade may result on average to 4 partial trades,
due scaling out and rebuilding the positions, and averaging up; we have on average 830 partial trades performed annually)
We ran 5,000 simulations, each one with 240 trades = 1,200,000 trades are simulated.
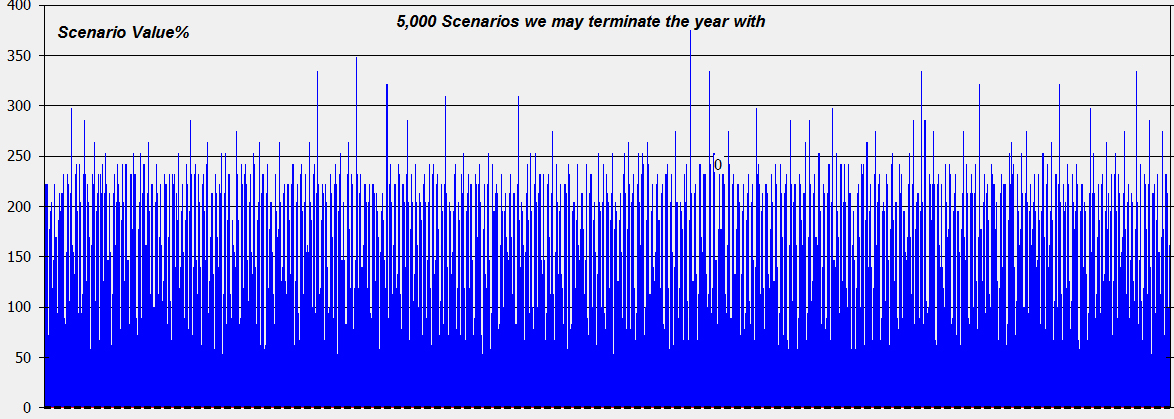
The graph above represents 5,000 scenarios we may have in spread of 5,000 years, as a result of the above inputs.
We got the following:
Average year return: +134%
Standard Deviation: 64%
Maximum Peak to Trough DrawDown: -20.5%
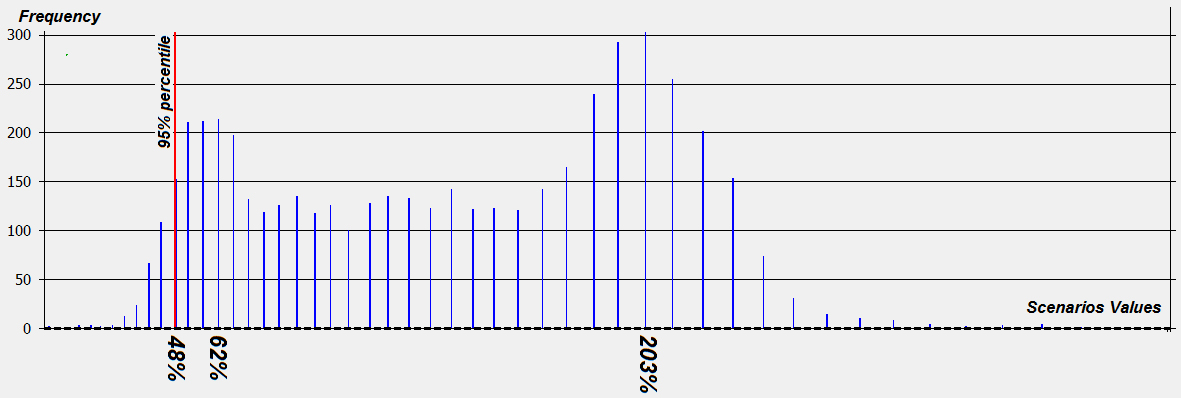
The graph above represents the frequency of values we may have out of the 5,000 scenarios.
The 95% percentile of the above data equals to: +48% which represents the yearly VAR at 95% confidence level.
This means there is only 5% probability to have a year with gross profit less than +48%.
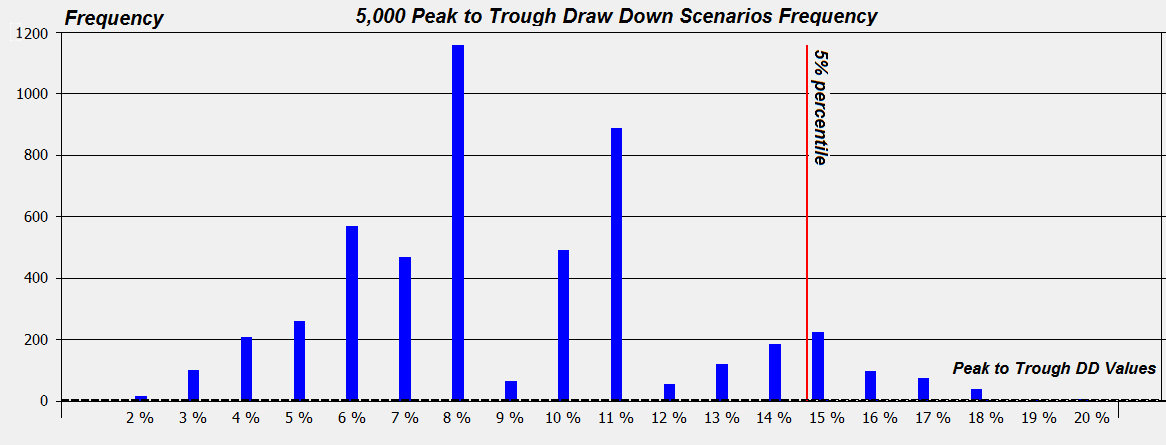
The graph above represents the frequency of Peak to Trough Draw Down Values we may have out of the 5,000 Scenarios.
The 5% Percentile of the above data equals to : -15.4%, which means there is 95% probability to have a peak to trough draw down less than -15.4%.